New Zealand's recent bank performance in three graphs
A bit late, but here are some updated graphs of the largest New Zealand banks.
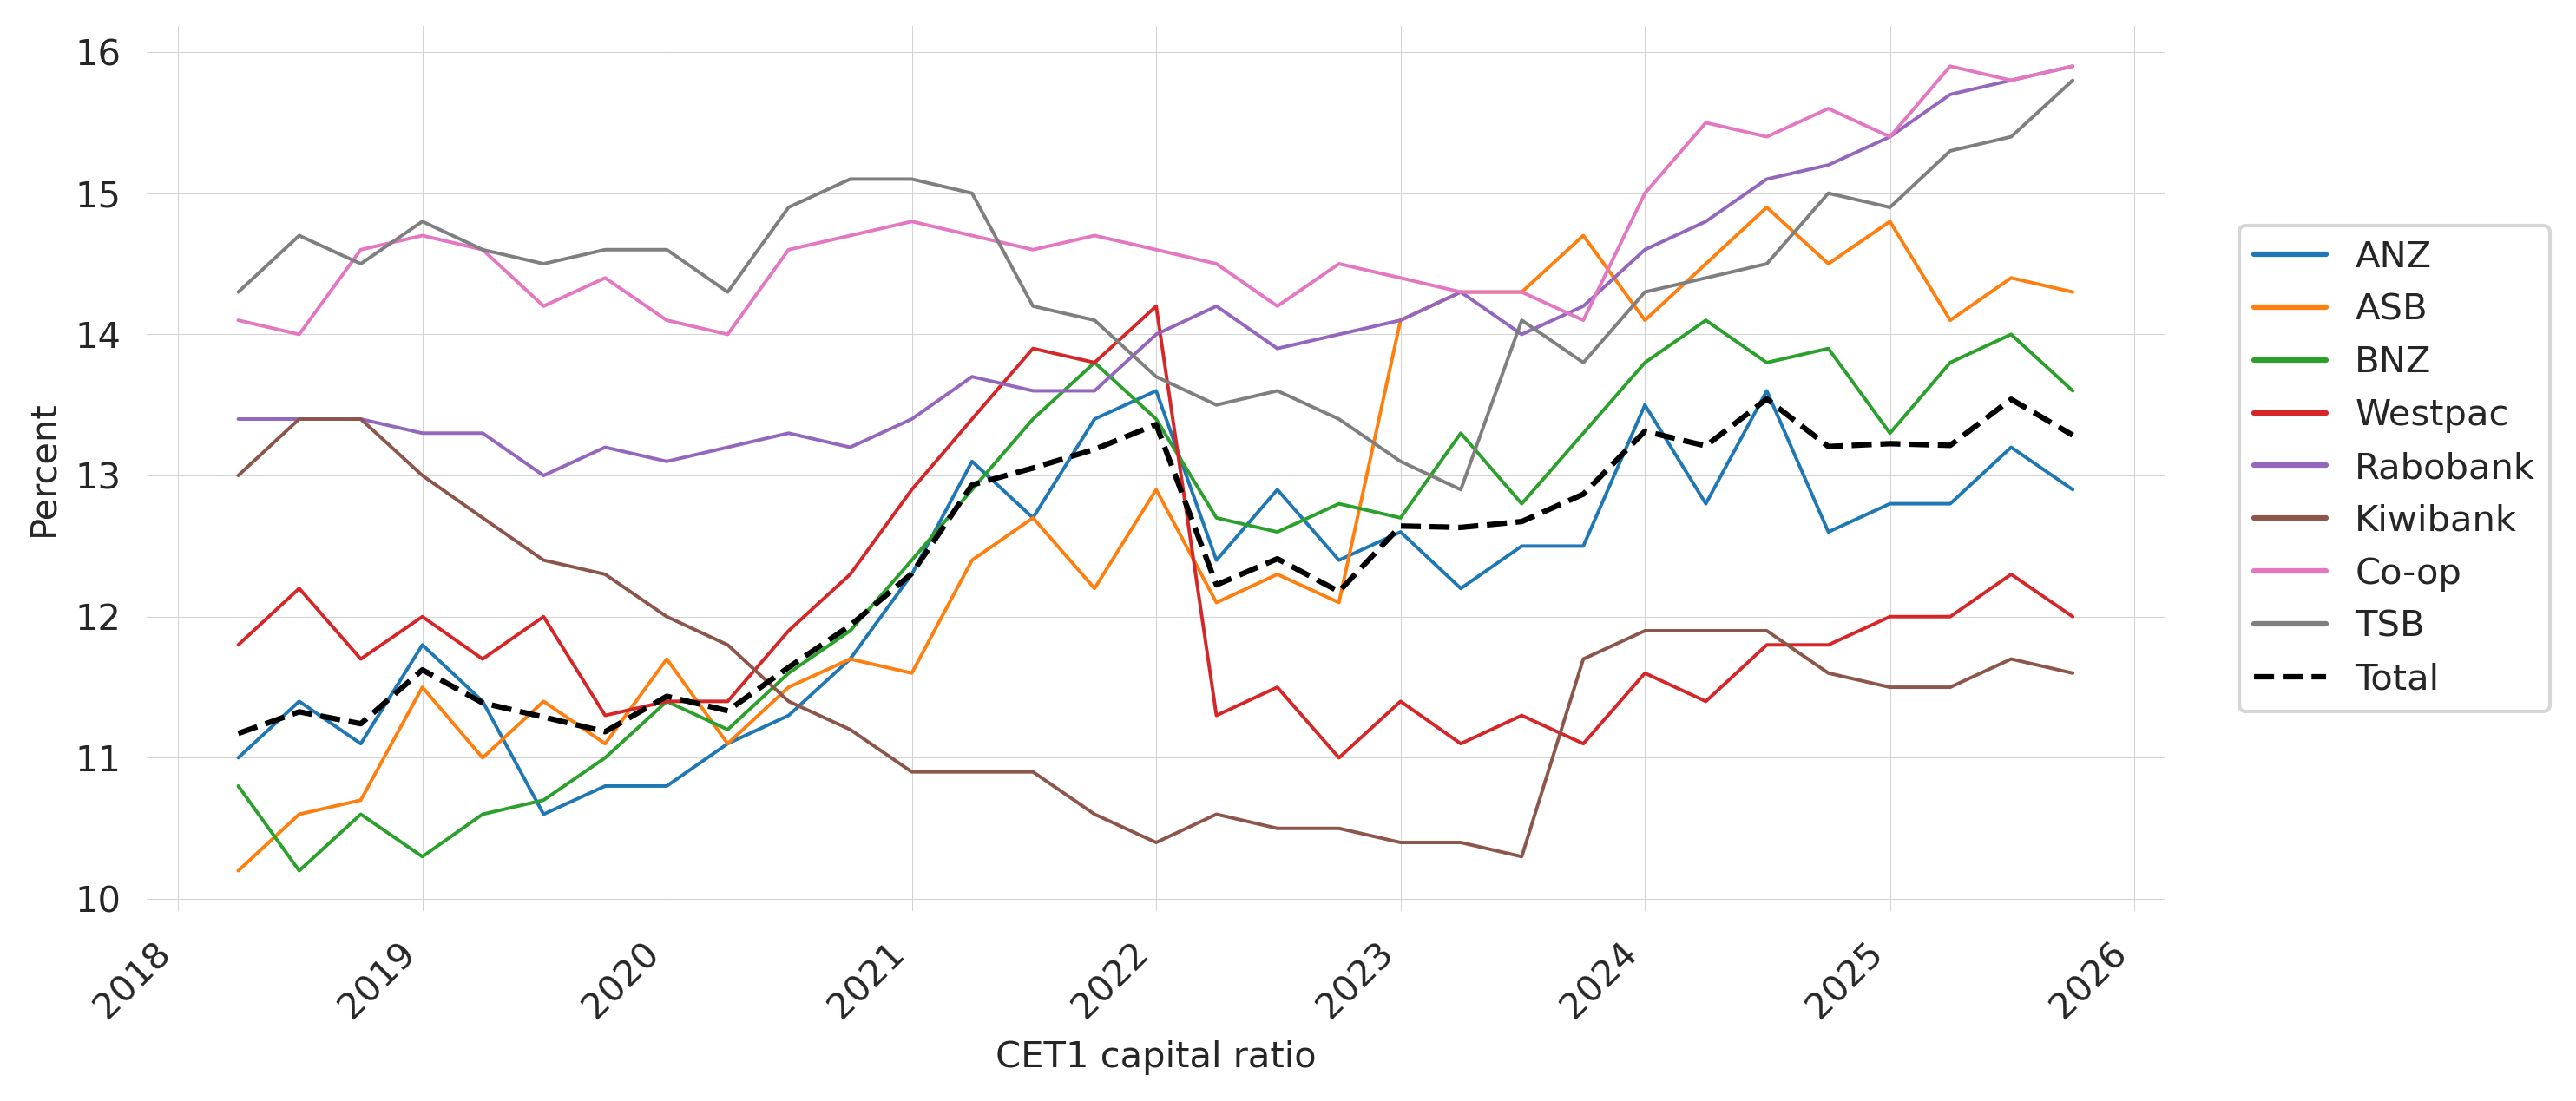
As I noted in a previous post, the Big 4 and Kiwibank have read the memo and appear to have relaxed capital levels. At the same time, the Cooperative Bank, Rabobank, and TSB continue increasing CET1 ratios. The market is apparently at work here.
Profitability, measured by quarterly ROE, appears unmoveable, and the split between large and small banks persists. Kiwibank’s profitability remains concerning. The combination of capital depletion and lacklustre profitability, sustained over such a long period, raises questions about the bank’s strategic direction and risk management.
Net interest income has declined for Rabobank, which is predictable given the economic cycle. Kiwibank continues to struggle on this measure as well.
Taken together, these trends suggest a banking sector responding to regulatory signals while maintaining established profitability hierarchies. The divergence in capital strategies indicates healthy market competition, but Kiwibank’s sustained underperformance across multiple metrics warrants continued supervisory attention.
Source: my own calculations and the RBNZ Dashboard


